An Overview On RNA Sequence Analysis
by Adriana Gallego, Ph.D.

by Adriana Gallego, Ph.D.
The analysis of RNA sequences has evolved from measuring single transcripts using gel electrophoresis and PCR methods to measuring millions of RNA sequences obtained using high throughput sequencing approaches.
We will take a deeper dive into modern RNA analysis using RNA-Seq as well as review the old method of RNA analyses.
In this article
Main steps in RNA sequences analyses from RNA-Seq
3.Gene and transcript expression
With the improvement of computational power and sequencing technologies, RNA sequencing has emerged as a powerful tool for transcriptome profiling. This approach enables genome-wide quantification of gene expression, also known as transcriptomics.
Two major RNA sequencing technologies have been recognized. The first is hybridization-based, where microarrays are used and the second is based on sequencing by synthesis.
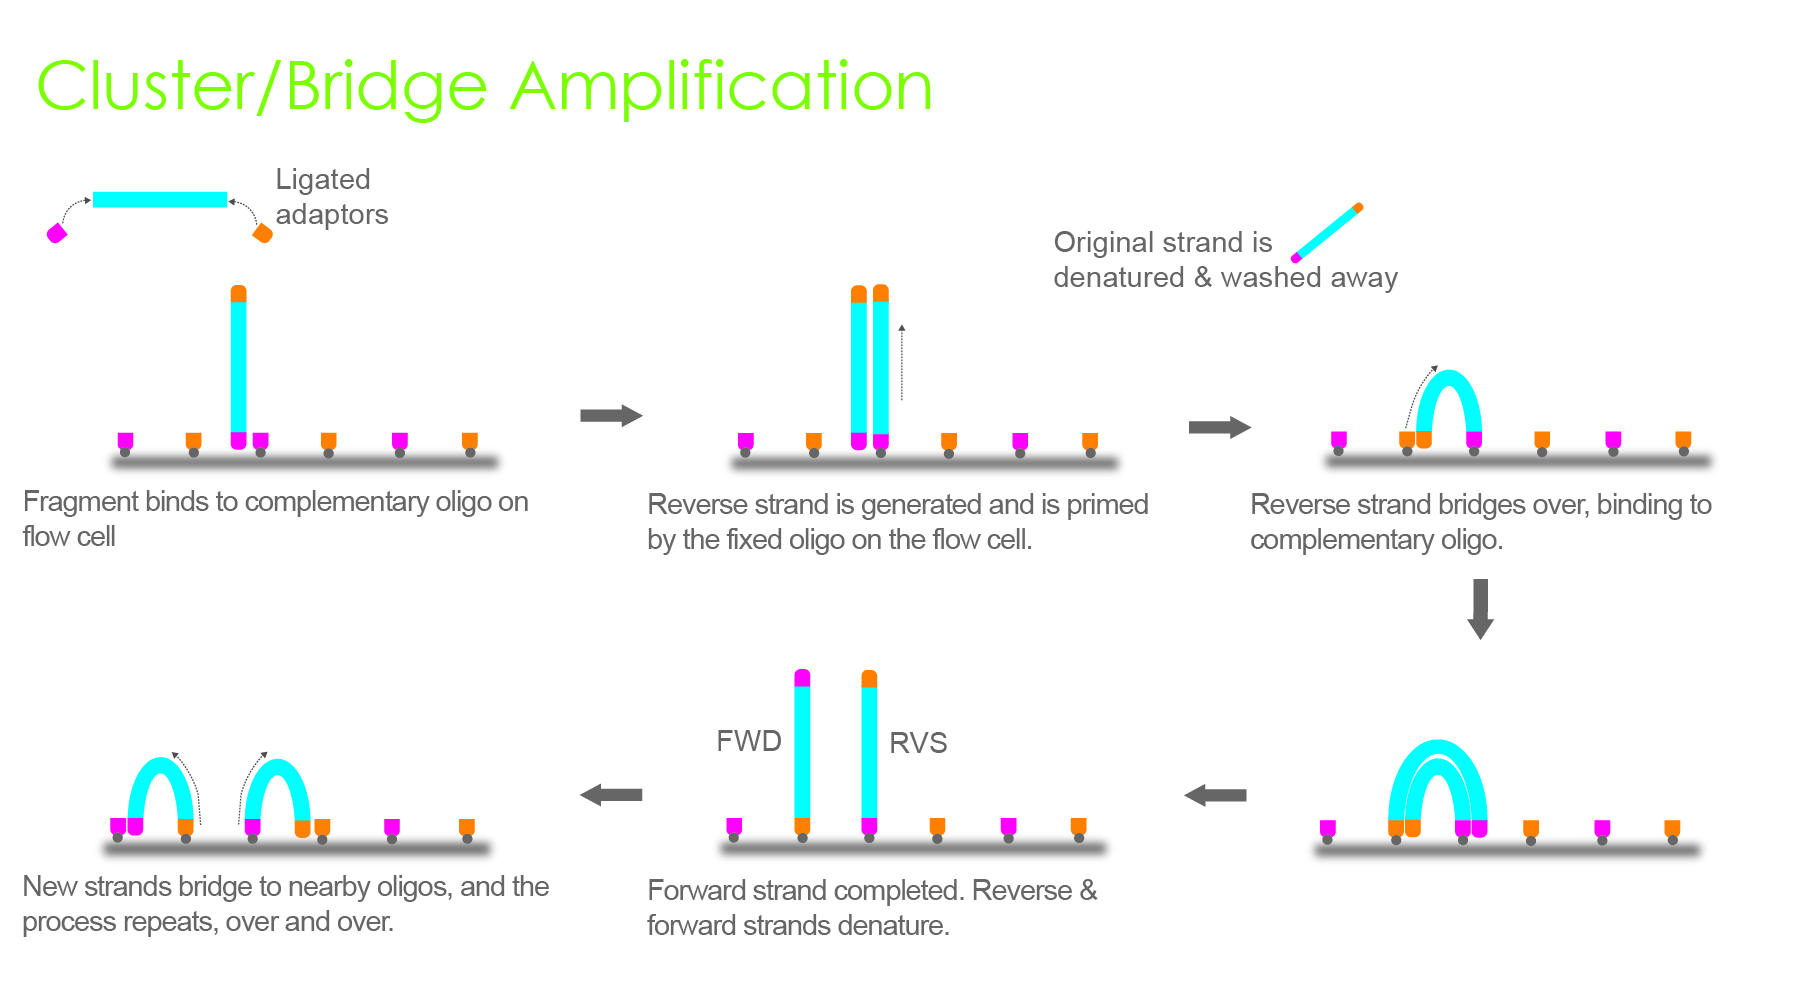
The second approach is based on synthesis, where four fluorescently labeled nucleotides are used to sequence the tens of millions of clusters on the flow cell surface in parallel after RNA library preparation.
This technology is better known as RNA-Seq.
With the rise of RNA-Seq, the biological differentiation of critical isoforms and the detection of low and very high abundant transcripts is possible.
In addition, RNA‐seq delivers both less biased and previously unknown information about the transcriptome because the technology gives detailed RNA sequences. In other words, previous knowledge of an organism's RNA is unnecessary.
All these advantages made RNA-Seq the preferred technology for large‐scale gene expression studies.
However, this powerful technology simultaneously provides an enormous amount of raw data that creates an equally enormous challenge to analyze in the moment.
Gene expression profiling by RNA-Seq technology provides a high-resolution view of the global transcriptional landscape.
However, a prerequisite for a successful RNA-seq experiment is that data generated can answer the raised biological questions.
RNA-Seq can be used to quantify gene expression levels, discover novel gene structures, identify alternatively spliced isoforms, and allele-specific expression.
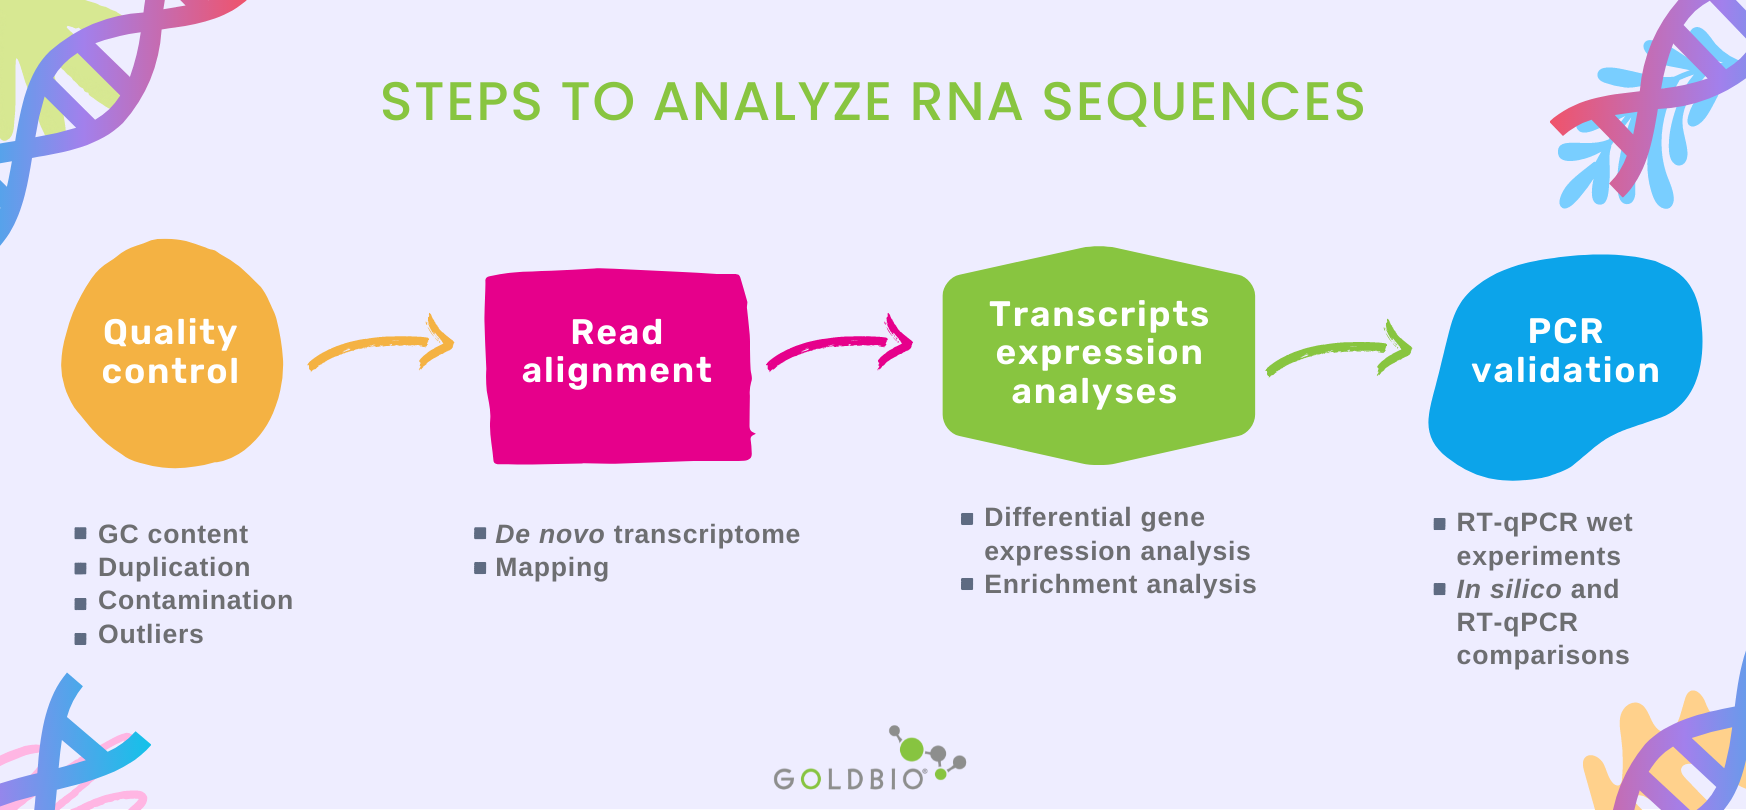
There are three main steps to RNA sequence analyses from RNA-Seq, which include 1) quality control, 2) read alignment, and 3) gene and transcript expression analysis.
RNA-Seq provides data sequences in the form of "reads." These reads are sequences of base pairs coming from an RNA transcript fragment.
Today Illumina platforms allows us to sequence fragments of transcripts but not the whole transcript because the polymerase capacity is too limited
However, new technologies such as PacBio and Oxford Nanopore are overcoming these limitations in polymerase capacities, and longer fragments, even whole transcripts depending on the size, are now being produced.
In the quality control, reads are analyzed in terms of GC content, the presence of adaptors, overrepresented k-mers, and duplicated reads to detect sequencing errors, PCR artifacts, or contaminations.
|
Tools to perform quality control |
|
|
FastQC |
Useful in quality control for Illumina reads |
|
NGSQC |
Useful in quality control for any platform (Illumina, PacBio) |
|
FASTX-Toolkit and Trimmomatic |
Used to discard low-quality reads, trim adaptor sequences, and eliminate poor-quality bases |
You have two options when doing a read alignment. If you have a reference genome, you can map.
But if you do not have a reference genome, you will need to build the transcriptome from scratch, overlapping the reads to create contigs.
This method is also known as "de novo transcriptome."

A contig is a sequence resulting from the reassembly of the small overlapping reads. These contigs can later be overlapped to produce scaffolds and get closer to building transcript fragments.
In the de novo transcriptome analysis, it is possible to identify new genes or transcripts that will need to be validated by being compared to biological databases or sequences from related- species.
Variables such as contig/scaffold length and the number of contigs/scaffolds are essential in the de novo analysis.

Alternatively, when mapping to a reference genome, the aim is to identify genes already present in the reference. The percentage of mapped reads is a critical quality parameter during the mapping process.
It works as a global indicator of the overall sequencing accuracy and of the presence of contaminating DNA.
Other things to consider are the mapped strand and the uniformity of read coverage on exons.
Different tools are used and described below for both mapping and de novo transcriptome analyses.
|
Tools to perform read alignment |
|
|
Mapping |
Cufflinks, Scripture, HISAT, TopHat |
|
de novo transcriptome analysis |
SOAPdenovoTrans, Oases, Trans-ABySS, and Trinity |
The most common application of RNA-seq is to estimate gene and transcript expression.
Differential gene expression analysis requires that gene expression values be compared among samples.
The magic behind this analysis consists of using Bayesian statistics and algorithms that consider factors such as transcript length, the total number of reads, and sequencing biases.
Some tools like edgeR, limma-voom, DESeq, DESeq2, and maSigPro let researchers perform multiple comparisons, including different analyze time-series data.
After the identification and gene expression analysis, the functional characterization of transcripts using biological databases can be done through two approaches:

In the past, if researchers wanted to analyze RNA, they resorted to low-throughput methods, such as northern blots and quantitative polymerase chain reaction (qPCR) techniques. These techniques only allowed researchers to measure a single up to a few transcripts.
In the case of northern blots, RNA molecules in a sample were separated by size using gel electrophoresis. Then, RNA fragments were transferred from the gel to the surface of a membrane after exposure to a DNA probe labeled with a radioactive or chemical tag. Finally, if the probe binds to the membrane, the complementary RNA sequence was present in the sample.
Furthermore, qPCR was used to quantify the expression of transcripts by amplifying the target molecule thousands of times and then comparing it to a reference after PCR.
Although these techniques are still currently used, one drawback is they can only measure the steady-state mRNA accumulation levels. Therefore, researchers cannot measure transcription rates or RNA stability.
Furthermore, researchers can only identify the presence/absence and quantify the absolute RNA molecule amount.
Additionally, they cannot access the sequence if the RNA molecule is unknown in advance. In that case, expensive sequencing technologies such as Sanger commonly used at that time revealed the sequence of their RNA molecules.
The traditional way to analyze a single RNA sequence would be the following steps:
A straightforward method to facilitate interpreting the extensive data derived from RNA-Seq consists of using visualization tools.
Visualization can be done at the level of reads (e.g., using ReadXplorer) or at the level of unnormalized reads (without statistical analysis).
These can be expressed as total count or normalized reads using genome browsers such as the UCSC browser, Integrative Genomics Viewer (IGV), Genome Maps, or Savant.
Some other visualization tools are designed explicitly for visualizing multiple RNA-seq samples at once, such as RNAseqViewer, which provides user-friendly ways to display the reads.
Similarly, graphs like heatmaps can help visually compare signals on multiple samples.
Within differential gene expression packages, like DESeq2 or DEXseq in Bioconductor, exist functions to enable the visualization of results, whereas CummeRbund from CuffDiff was exclusively designed for visualization purposes.
Here, the Sashimi plots can be used to visualize differentially spliced exons in an aesthetic way.
RNA-Seq constitutes one of the most powerful technologies in transcriptomic analysis, providing millions, or even billions, of short reads like the starting point of RNA sequence analysis.
However, these significant amounts of data require researchers to have basic skills in interpreting these data.
Scientists must consider quality control, read alignment with and without a reference genome, obtaining metrics for gene and transcript expression, and approaches for detecting differential gene expression during RNA-Seq analysis.
It is also important to have checkpoints at each analysis step due to biases of the data that can arise throughout the RNA-Seq experimental pipeline, including during RNA extraction, sample preparation, library construction, sequencing, and read mapping.
We hope that the steps and overview provided in this article provides a clearer map for RNA-seq analysis and interpretation.
RNA, sequence analysis, RNA-Seq, transcriptome.
Conesa, A., Madrigal, P., Tarazona, S., Gomez-Cabrero, D., Cervera, A., McPherson, A., Szczesniak, M. W., Gaffney, D. J., Elo, L. L., Zhang, X., & Mortazavi, A. (2016). A survey of best practices for RNA-seq data analysis. Genome Biol, 17(1), 13.
Geraci, F., Saha, I., & Bianchini, M. (2020). Editorial: RNA-Seq Analysis: Methods, Applications and Challenges. Frontiers in Genetics, 11(March), 10–12.
Koch, C., Chiu, S., Akbarpour, M., Bharat, A., Ridge, K., Barton, E., & Winter, D. (2018). A Beginner’s Guide to Analysis of RNA-seq Data. Am J Respir Cell Mol Biol, 59(2), 145–157.
Kukurba, K., & Montgomery, S. (2015). RNA Sequencing and Analysis. Cold Spring Harb Protoc., 11, 951–969.
Norsuzila Ya’acob, M., Abdullah, M., Ismail, Medina, M., Talarico, T. L., Casas, I. A., Chung, T. C., Dobrogosz, W. J., Axelsson, L., Lindgren, S. E., Dobrogosz, W. J., Kerkeni, L., Ruano, P., Delgado, L. L., Picco, S., Villegas, L., Tonelli, F., Merlo, M., Rigau, J., … Masuelli, M. (1989). We are IntechOpen , the world ’ s leading publisher of Open Access books Built by scientists , for scientists TOP 1 %. Intech, 32, 137–144. http://www.intechopen.com/books/trends-in-telecommunications-technologies/gps-total-electron-content-tec- prediction-at-ionosphere-layer-over-the-equatorial-region%0AInTec

IPTG and auto-induction are two ways to induce protein expression in bacteria. They work similarly, but have different trade-offs in terms of convenience. While IPTG...

The final concentration of IPTG used for induction varies from 0.1 to 1.0 mM, with 0.5 or 1.0 mM most frequently used. For proteins with...

A His-tag is a stretch of 6-10 histidine amino acids in a row that is used for affinity purification, protein detection, and biochemical assays. His-tags...

Competent cells such as DH5a, DH10B, and BL21 will maintain their transformation efficiency for at least a year with proper storage. It is important to...