Four Primary Steps and Tools for NGS Data Analyses
by Adriana Gallego, Ph.D.

by Adriana Gallego, Ph.D.
What do you do with millions of data? It is a recurrent question in sequencing projects. Analyzing NGS data requires more than a powerful computer. You must prepare and have a general knowledge of the steps and tools available to analyze massive data.
Although there are many ways you can analyze your NGS data, there are four general steps that can help with NGS data analysis. The key steps for NGS data analysis are cleaning, data exploration, visualization, and deepening.
Whether you perform genomic, gene expression, or methylation analyses, you can apply these steps in this article and some valuable tools to help you process high-throughput data.
Article Table of Contents
Four steps for NGS Data Analysis
Step 2. Exploration of NGS data
Step 3. Visualization of NGS data
Step 4. Deeper analyses of NGS data
Tools for Whole Genome Sequencing Data Analysis
Tools for RNA Sequencing Data Analysis
Tools for Methylation Data Analysis
The good thing about the data cleaning, exploration, visualization, and deepening steps is they can be used no matter the NGS application. Therefore, let me explain each step, why they matter, and the expected results.
Cleaning data in NGS means rescuing meaningful biological data from raw data fresh off the sequencer.
From the beginning, you don't know whether data will be biologically crucial for your study.
However, researchers have developed tools based on algorithms to perform these analyses.
In the data cleaning process, small sequences (usually below 20bp) and adapters from the library prep are removed.
Afterward, the quality of the data is revised using the Phred score.
The Phred score tells you the probability of a base being incorrectly called. It goes from 10 to 50 in units of 10. For instance, a Phred Score of 30 indicates the likelihood of finding one incorrect base call among 1000 bases. In other words, the accuracy in correctly identify the base is 99.9% for a score of 30.

Figure 1. Phred score table and benchmark.
To clean NGS data, researchers use a tool called FastQC to analyze data. This tool provides graphs and thresholds that help you to select which data to remove or not.

Figure 2. Sequence quality analysis based on FastQC output.
The cleaning process is essential because it leads you to work with meaningful biological data and allows you to better interpret your data. When you don't have junk data, you are more likely to find clear patterns that explain your treatments.
After you perform the cleaning process and are confident with the data quality, you go on to explore your data.
Working with millions of sequences may sound overwhelming. Fortunately, there is software and tools to help you reduce the data dimensionality. Now, with advances in these tools, you can explore your data with easy-to-understand graphs.
The most common technique is to run a principal component analysis or PCA.
A PCA aims to reduce the data dimensionality by performing a type of clustering of the data. Then, the main two main categories of clustering (that groups most of the data) are called components.
The first and second components allow you to create a graph. PCA also tells you which variables (e.g., genes) are most valuable for the clustering.
I know it may sound hard to follow, so to help you a little more, you might want to check out the following video.

Figure 3. A simple overview of a PCA in NGS.
Data exploration in NGS helps you identify the sample's behavior. You can detect outlier samples, how the samples cluster under the different treatments, and the intravariability of the samples.
After getting a glimpse of how the samples look, you are ready to dig into a more profound analysis, which will vary according to the NGS goal.
An excellent way to interpret NGS data is through graphs. Visualizing NGS data is critical to interpreting and extracting their biological meaning.
In NGS data visualization, different tools are used to graph the data according to the NGS application.
For instance, in whole genome sequencing, circular layouts are commonly used to display the overall data and present genes or genomes.
In gene expression analyses, heatmaps are widely used to describe the differences in expression between two or more treatments. Network graphs are also commonly used to show co-relation expression analyses.
In the case of epigenomic profiling studies, heatmaps and histograms are commonly used to present differences in methylation rates.
Visualization of NGS data helps you extract meaningful information over an ocean of data. Furthermore, visualization tools help you to summarize and highlight the most important information.
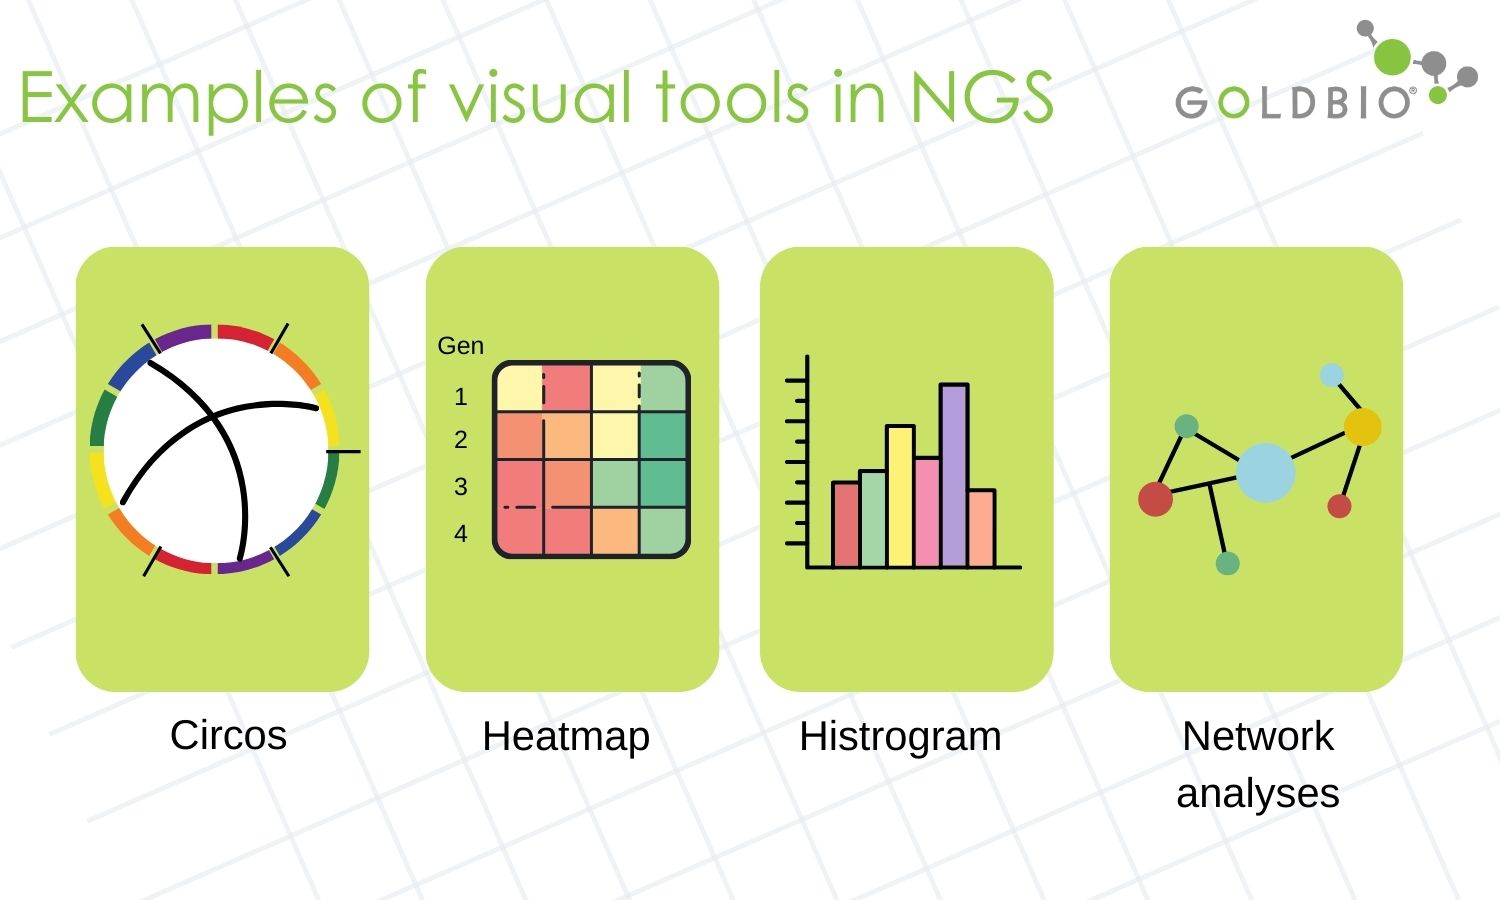
Figure 4. Examples of common tools used in visualization of NGS data.
Depending on the goals in NGS data, different and more deeper analyses can be explored and they will vary with each NGS application.
For instance, WGS data can be used to perform variant analyses, microsatellites marker detection or sequencing of plasmids in cloning protocols. For each of these analyses, different software and tools can be applied.
Deeper analyses help you to extract useful information and get additional information which can be contrasted with previous studies. Deeper analyses can also provide you with novel information to be reported for first time.
Deeper analyses are important because NGS tools are updated often, so new tools can be regularly applied when more NGS data is made available.
Here is worth mentioning that you can perform metanalyses. Sometimes researchers do not sequence from scratch, instead, they recycle data from previous reported articles to apply new tools and methodologies and so give a new interpretation to old data.
There are many tools already developed for each NGS application. Although the list is extensive and cannot be included in this paper, my recommendation is to read enough about your NGS application (WGS, RNA-Seq, etc.) and develop very clear goals.
In the tables below, I included some tools for each stage of NGS data.
|
Step |
Tool name |
|
Data cleaning |
|
|
Data exploration |
|
|
Data visualization |
|
|
Deeper analyses |
For variant analysis (FreeBayes, GATK, Platypus, Samtools/mpileup, SNVer, VarScan, VarDict) |
|
Step |
Tool name |
|
Data cleaning |
|
|
Data exploration |
|
|
Data visualization |
|
|
Deeper analyses |
For mapping tools (Hisat) For de novo assembly (Trinity, Soap de novo) For gene expression profiling (Deseq2) |
|
Step |
Tool name |
|
Data cleaning |
|
|
Data exploration |
|
|
Data visualization |
|
|
Deeper analyses |
|
Step |
Tool name |
|
Data cleaning |
|
|
Data exploration |
|
|
Data visualization |
|
|
Deeper analyses |
|
Step |
Tool name |
|
Data cleaning |
|
|
Data exploration |
|
|
Data visualization |
|
|
Deeper analyses |
For variant analysis (FreeBayes, GATK, Platypus, Samtools/mpileup, SNVer, VarScan, VarDict) |
|
|
|
|
|
|
|
|
|
|
|
|
|
|
|
NGS data analysis, visualization tools for NGS, NGS tools for data interpretation.
An, O., Tan, K.-T., Li, Y., Li, J., Wu, C.-S., Zhang, B., Chen, L., & Yang, H. (2020). CSI NGS Portal: An Online Platform for Automated NGS Data Analysis and Sharing. International Journal of Molecular Sciences, 21(11), 3828. https://doi.org/10.3390/ijms21113828
Bani Baker, Q., Hammad, M., Al-Rashdan, W., Jararweh, Y., AL-Smadi, M., & Al-Zinati, M. (2020). Comprehensive comparison of cloud-based NGS data analysis and alignment tools. Informatics in Medicine Unlocked, 18, 100296. https://doi.org/10.1016/j.imu.2020.100296
Belien, J. A. M., Kip, A. E., & Swertz, M. A. (2022). Road to FAIR genomes: A gap analysis of NGS data generation and sharing in the Netherlands. BMJ Open Science, 6(1), e100268. https://doi.org/10.1136/bmjos-2021-100268
Bianchi, V., Ceol, A., Ogier, A. G. E., de Pretis, S., Galeota, E., Kishore, K., Bora, P., Croci, O., Campaner, S., Amati, B., Morelli, M. J., & Pelizzola, M. (2016). Integrated Systems for NGS Data Management and Analysis: Open Issues and Available Solutions. Frontiers in Genetics, 7. https://doi.org/10.3389/fgene.2016.00075
Datta, S., & Nettleton, D. (Eds.). (2014). Statistical Analysis of Next Generation Sequencing Data. Springer International Publishing. https://doi.org/10.1007/978-3-319-07212-8
Gong, Y.-N., Chen, G.-W., Yang, S.-L., Lee, C.-J., Shih, S.-R., & Tsao, K.-C. (2016). A Next-Generation Sequencing Data Analysis Pipeline for Detecting Unknown Pathogens from Mixed Clinical Samples and Revealing Their Genetic Diversity. PLOS ONE, 11(3), e0151495. https://doi.org/10.1371/journal.pone.0151495
Kathiresan, N., Temanni, R., Almabrazi, H., Syed, N., Jithesh, P. V., & Al-Ali, R. (2017). Accelerating next generation sequencing data analysis with system level optimizations. Scientific Reports, 7(1), 9058. https://doi.org/10.1038/s41598-017-09089-1
Milicchio, F., Rose, R., Bian, J., Min, J., & Prosperi, M. (2016). Visual programming for next-generation sequencing data analytics. BioData Mining, 9(1), 16. https://doi.org/10.1186/s13040-016-0095-3
Nusrat, S., Harbig, T., & Gehlenborg, N. (2019). Tasks, Techniques, and Tools for Genomic Data Visualization. Computer Graphics Forum, 38(3), 781-805. https://doi.org/10.1111/cgf.13727
Stadtländer, C. T. K.-H. (2018). Next-generation sequencing data analysis. Briefings in Bioinformatics, 19(5), 1082-1083. https://doi.org/10.1093/bib/bbx038
Wadapurkar, R. M., & Vyas, R. (2018). Computational analysis of next generation sequencing data and its applications in clinical oncology. Informatics in Medicine Unlocked, 11, 75-82. https://doi.org/10.1016/j.imu.2018.05.003
, visualization tools for NGS, NGS tools for data interpretation.
An, O., Tan, K.-T., Li, Y., Li, J., Wu, C.-S., Zhang, B., Chen, L., & Yang, H. (2020). CSI NGS Portal: An Online Platform for Automated NGS Data Analysis and Sharing. International Journal of Molecular Sciences, 21(11), 3828. https://doi.org/10.3390/ijms21113828
Bani Baker, Q., Hammad, M., Al-Rashdan, W., Jararweh, Y., AL-Smadi, M., & Al-Zinati, M. (2020). Comprehensive comparison of cloud-based NGS data analysis and alignment tools. Informatics in Medicine Unlocked, 18, 100296. https://doi.org/10.1016/j.imu.2020.100296
Belien, J. A. M., Kip, A. E., & Swertz, M. A. (2022). Road to FAIR genomes: A gap analysis of NGS data generation and sharing in the Netherlands. BMJ Open Science, 6(1), e100268. https://doi.org/10.1136/bmjos-2021-100268
Bianchi, V., Ceol, A., Ogier, A. G. E., de Pretis, S., Galeota, E., Kishore, K., Bora, P., Croci, O., Campaner, S., Amati, B., Morelli, M. J., & Pelizzola, M. (2016). Integrated Systems for NGS Data Management and Analysis: Open Issues and Available Solutions. Frontiers in Genetics, 7. https://doi.org/10.3389/fgene.2016.00075
Datta, S., & Nettleton, D. (Eds.). (2014). Statistical Analysis of Next Generation Sequencing Data. Springer International Publishing. https://doi.org/10.1007/978-3-319-07212-8
Gong, Y.-N., Chen, G.-W., Yang, S.-L., Lee, C.-J., Shih, S.-R., & Tsao, K.-C. (2016). A Next-Generation Sequencing Data Analysis Pipeline for Detecting Unknown Pathogens from Mixed Clinical Samples and Revealing Their Genetic Diversity. PLOS ONE, 11(3), e0151495. https://doi.org/10.1371/journal.pone.0151495
Kathiresan, N., Temanni, R., Almabrazi, H., Syed, N., Jithesh, P. V., & Al-Ali, R. (2017). Accelerating next generation sequencing data analysis with system level optimizations. Scientific Reports, 7(1), 9058. https://doi.org/10.1038/s41598-017-09089-1
Milicchio, F., Rose, R., Bian, J., Min, J., & Prosperi, M. (2016). Visual programming for next-generation sequencing data analytics. BioData Mining, 9(1), 16. https://doi.org/10.1186/s13040-016-0095-3
Nusrat, S., Harbig, T., & Gehlenborg, N. (2019). Tasks, Techniques, and Tools for Genomic Data Visualization. Computer Graphics Forum, 38(3), 781-805. https://doi.org/10.1111/cgf.13727
Stadtländer, C. T. K.-H. (2018). Next-generation sequencing data analysis. Briefings in Bioinformatics, 19(5), 1082-1083. https://doi.org/10.1093/bib/bbx038
Wadapurkar, R. M., & Vyas, R. (2018). Computational analysis of next generation sequencing data and its applications in clinical oncology. Informatics in Medicine Unlocked, 11, 75-82. https://doi.org/10.1016/j.imu.2018.05.003

Antibiotics are powerful tools that protect cell culture from contamination and help select for transfected cells. However, antibiotics can also have subtle impacts on resistant...

Antibiotics and cell selection agents are used to isolate cells that contain a particular resistance marker from a mixed population. These powerful reagents are used...

During my undergraduate internship I was making different formulations of insulin nanoparticles that would, in theory, be delivered through an inhaler and into the lungs....

The cell selection agents puromycin, blasticidin, hygromycin and G418 kill prokaryotic and eukaryotic cells by inhibiting protein translation. Deciding which selection agent, and how much...