DNA Gel Electrophoresis Introduction & Overview
by Pallabi Roy Chakravarty, Ph.D.

by Pallabi Roy Chakravarty, Ph.D.
Electrophoresis is a technique where similarly charged molecules in a mixture flow in the same direction using an electric field, and the molecules are separated based on size.
In this method, separation of the molecular components of the mixture is strictly based on size (molecular weight). The charge of the molecules is exploited just to ensure their mobility when an electric field is applied.
This technique is commonly used in the separation of biological macromolecules such as nucleic acids (DNA) and proteins. This article will specifically focus on DNA electrophoresis.
In this article:
How does electrophoresis separate DNA fragments in a mixture?
Role of an electric current in gel electrophoresis
Role of agarose gel in gel electrophoresis
Factors determining how fast/ far a DNA migrates through a gel
The importance of gel concentration
Agarose gels and DNA conformation
How to visualize DNA molecules in a gel
Drawing scientific inferences from a DNA gel
Number of DNA fragments in a DNA mix:
Size of fragments in a DNA sample:
Estimating concentration of DNA in a sample:
.png)
Imagine you have a mixture of sand and gravel that you need to separate. What is the easiest way to do it? Just pass the mixture through a sieve, which lets only the sand particles pass through while holding the large sized gravel chips.
This is a great example of separation based on size. However, something to note is the components of the mixture (sand particles and gravel stone chips) need to move to facilitate the size-based separation. The force that brings about this mobility is gravity.
Now imagine you have a mixture of DNA fragments of different sizes. How can we separate them?
We can do this by applying the same principle we used for separating the sand and gravel mixture – of course with some modifications.

Figure 1. Comparing the separation of a sand-gravel mix to the separation of a mixture of DNA fragments of varying molecular weights.
Figure 1 illustrates the principle of size-based separation under the influence of an external force driving mobility. Gravity is the driving force in the sand and gravel example. And the electric current is what drives movement in the DNA example.
The force that moves the DNA is an electric field.
“Phoresis” in Greek means to mechanically carry. Therefore, in electrophoresis, DNA molecules are carried by electromotive force that facilitates mobility.
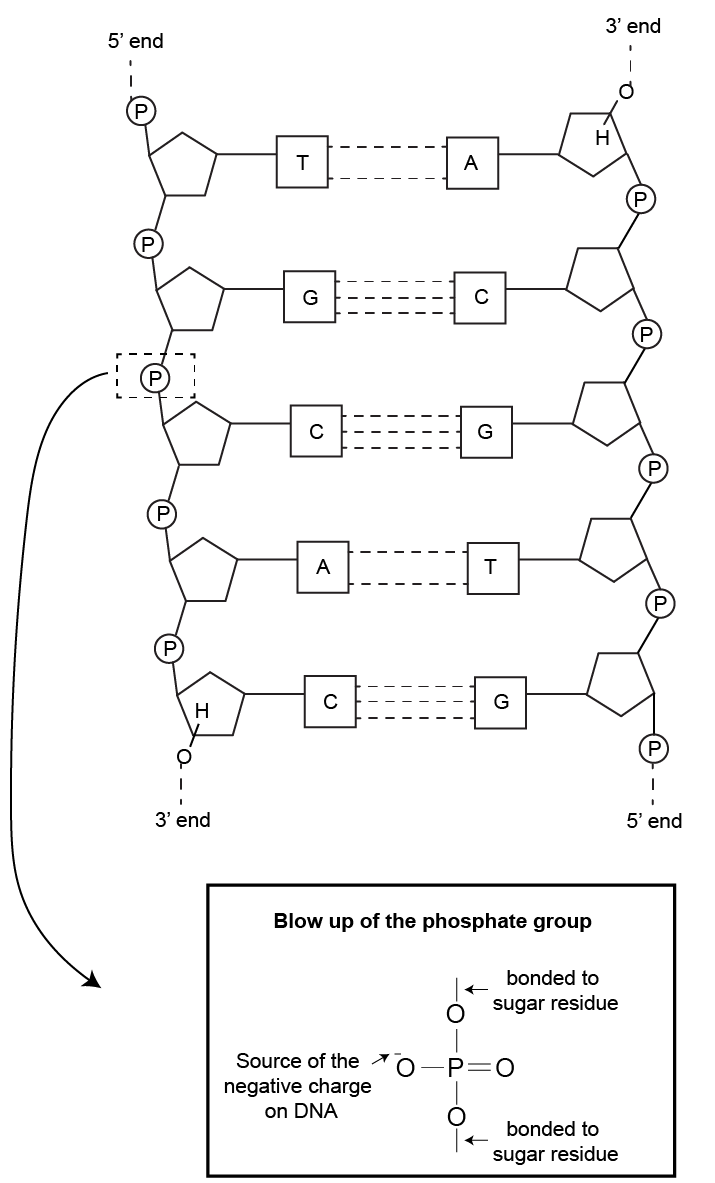
As pictured below in figure 2, DNA is a negatively charged molecule due to the phosphate groups on its sugar-phosphate backbone. When exposed to an electric field, DNA will migrate towards the positive electrode.

Figure 2. DNA structure highlighting its negative charge.
A gel composed of agarose is analogous to our example of the sieve that separates the sand particles from the larger gravel debris.
Agarose is a type of polysaccharide obtained from a certain seaweed. When mixed with water, heated, and then cooled to room temperature, agarose forms a three-dimensional gel. Though solid to our eyes, at a microscopic level, this gel is a mesh structure.

That mesh is what makes an agarose gel like a molecular sieve.
Here the pore sizes range in nanometer scale, allowing only molecules, like DNA, to pass through.
When DNA fragments pass through an agarose gel under the influence of an electric field, the fragments migrate through the gel towards the positive electrode. Due to the molecular sieving action of the gel matrix, smaller sized DNA fragments are able to migrate further toward the positive electrode during a given time. Larger DNA fragments cannot move through the mesh easily and therefore migrate slower during a given amount of time. This ultimately results in size-based sorting of the DNA molecules that were there in the mix.
The two primary factors that affect fragment mobility in an agarose gel are a) the magnitude of the electric voltage applied, and b) the size of the DNA molecule.
As shown below in figure 3, the larger the DNA fragment, the shorter distance its migration through a gel.

Figure 3: Illustrates size-based separation of DNA in agarose gel electrophoresis.
The concentration of agarose in the gel determines the average pore size of the resulting gel mesh. The higher the agarose percent concentration, the smaller the average pore size of the matrix.
As a result, DNA migration negatively correlates with agarose percentage. DNA molecules take longer to travel through small pores than through pores of relatively larger diameter for migrating towards their ultimate destination. The positive electrode is depicted in the schematic diagram below (figure 4).

Figure 4. The negative correlation of DNA migration and agarose concentration in the gel.
In figure 4, sand of same texture and weight permeates slower through a sieve that has small pores and trickles faster through one with larger pores (left panel).
Similarly, DNA migrates faster through a gel of 1% agarose than through a gel of 3% agarose.
The conformation of a DNA fragment also determines its ability to migrate through the gel.
Let us illustrate this concept using the example of plasmids.
Uncut plasmids exist in at least three conformations: supercoiled, linear, and open circular. For a more detailed discussion on plasmid conformations please refer to this article.
Of the three plasmid conformations, supercoiled DNA, being the most compact form, migrates most easily, and therefore, farthest through an agarose gel. This is followed by the linear form, and then the open circular conformation, which migrates the shortest distance among these three uncut plasmid DNA conformations.
Whenever an uncut plasmid is run on an agarose gel, three bands are seen in this order of migration (shortest traveled distance to farthest traveled distance): open circular < linear < supercoiled.
But why does this happen?
Let us try to answer this question using a ball of wool as an analogy to a plasmid.
Consider a ball of yarn, that exists in three different conformations as depicted schematically in the figure below.
This yarn needs to be moved through an opening as depicted in figure 5. The left-most conformation of the yarn corresponds to the bulky open circular form of the plasmid, the middle one to the linear form and the right most one to the supercoiled form.
Note that the piece of wool in each of these conformations is of the same length.

Figure 5. Illustration of why conformation affects migration.
Which would move through the hole quickly? The most compact form (rightmost in the figure) or the bulkiest form (left most) or the linear one (center)?
As perhaps you can imagine, the wool in the right most conformation would be pulled out the fastest, followed by the center one and finally the left-most one.
Despite being of the same length, migration of the yarn depends on its conformation. This explains why the same plasmid in different conformations has different migration distances in an agarose gel.
When this same plasmid is linearized using restriction endonuclease (RE) digestion, this form, despite being the same molecular weight as the circular (non-linearized) plasmid, gives a single band when run through an agarose gel, because the supercoiled and open circular conformations are missing
This is an easy way to distinguish and separate linearized (by single site RE digestion) molecules from the undigested ones of the same plasmid.
DNA molecules are too small to be seen by the human eye. Even under a regular microscope, it’s not visible.
So how do scientists observe DNA molecules in an agarose gel to draw necessary inferences about DNA size, conformation etc.?
Researchers mix a compound called ethidium bromide with the agarose gel to visualize DNA in gels.
Ethidium bromide (EtBr) fluoresces under ultraviolet (UV) light and intercalates into the major groove of DNA, as shown below in figure 6.
Both these properties of EtBr have been used for staining and visualization of DNA in agarose gels.

Figure 6. a) Represents how EtBr intercalates into DNA. and b) As a result, how DNA bands fluoresce and show up under UV light.
When a compound inserts itself between the nucleoside bases of a nucleic acid molecule, it is called intercalation.
When an agarose gel is stained with EtBr, and held under UV, DNA shows up as fluorescent bands.
EtBr is considered carcinogenic, and safer alternative staining methods are prevalent nowadays. GoldBio’s GelRed products are alternatives worth considering.
An agarose gel with DNA bands is typically used by molecular biologists to determine certain things. Below are some of the most common insights scientists gain from visualizing electrophoresis:
When DNA is electrophoresed using an agarose gel, the molecules are sorted based on size. Therefore, if there are X number of different fragments in the sample, we’d see X number of bands in the gel.
So, the number of DNA fragments in a sample of DNA can be inferred by running a small portion of it in the gel.

Figure 7. First lane (from the left) has one DNA fragment while the second lane has two fragments.
This information can be important in many instances; for example, when the experimenter is assessing whether a plasmid has been digested.
An undigested plasmid has three bands that show up in a gel, while a single site digested (linearized) plasmid will show only one band.
Further, whether a restriction endonuclease cuts a plasmid at just one or multiple sites can be inferred by seeing the number of bands that show up on the gel when the digested plasmid sample is electrophoresed.
As shown below in figure 6b, by running a DNA sample alongside a DNA ladder in an agarose gel, the sizes of individual fragments (that show up as bands) can be estimated.
A DNA ladder is a mix of multiple DNA fragments of varying molecular weights. The sizes are known. When a ladder is run on an agarose gel, the fragments sort out based on their sizes.
The separated bands look like the rungs of a ladder, which is where DNA ladders get their name.
Typically, DNA ladders are commercially available, (GoldBio also carries ready-to-use ladders) and can be used as a reference to estimate the size of unknown DNA fragments that are run alongside the ladder.

Figure 8. Second lane (from the left) is a DNA ladder. Based on it, the sizes of the fragments run on lanes 1, 3 and 4 (from left) can be estimated.
Confirming the precise molecular weight of DNA fragments can be crucial for many experimental procedures, molecular cloning for example.
Before cloning a DNA fragment of interest, it is necessary to confirm its size by running the sample in a gel.
Assessment of the product(s) of a polymerase chain reaction (PCR) is also done using agarose gel electrophoresis.
If the concentration of a reference DNA sample (for example, a DNA ladder) is known, then the concentration of an unknown sample can be estimated by comparing the intensity of its band on the gel with the sample of a known concentration.

Figure 9.First lane from the left: DNA ladder with bands of known DNA concentration. Second and third lanes from the left: DNA bands of unknown concentration. By comparing fluorescent intensities of these bands with those of the ladder bands using densitometry software, the concentration of these samples can be figured out.

A His-tag is a stretch of 6-10 histidine amino acids in a row that is used for affinity purification, protein detection, and biochemical assays. His-tags...

Competent cells such as DH5a, DH10B, and BL21 will maintain their transformation efficiency for at least a year with proper storage. It is important to...

Ni2+ ions give nickel agarose beads their characteristic blue color. This blue color can fade or disappear completely when loading his-tagged proteins onto the column....

Nickel agarose beads change from blue to a brown or black color when the nickel ions have been reduced from a Ni2+ to a Ni1+...
